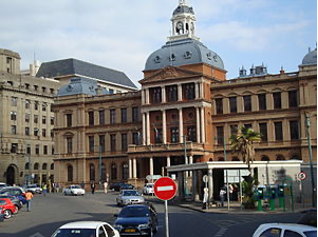
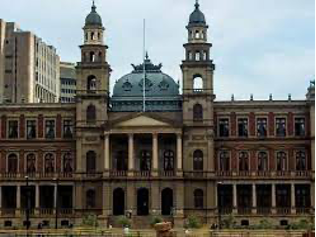
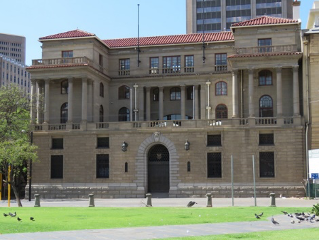
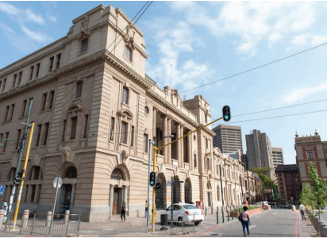
How to-banner (1)
Spatial planning

Step 3: Status quo assessment and precinct vision

The purpose of this step is to conduct a status quo assessment to understand the area dynamics, identify key opportunities, constraints and risks to inform planning and design, and to develop a design vision for the precinct.

The status quo assessment should cover the following aspects:
  • Definition of the identity and character of the precinct; and
  • Analysis of the built environment, the natural environment and the social and economic context

Where possible, the status quo assessment should draw on existing available information, where suitably detailed and current, but would need to be augmented by physical visits to assess site dynamics, spatial qualities, building typologies, more detailed movement patterns etc.
01
Clarify the precinct identity and character

Key positive aspects of identify and character should be retained, enhanced and highlighted in the design phase of the precinct. Identity and character have two dimensions, as follows:

  • The tangible or physical environment inclusive of both the built environment and natural environment.
  • Intangible dimension inclusive of the social, cultural and economic aspects of the precinct.
Character assessment: built environment

The intention here is to identify the places, spaces, structures and/or materials that are interesting or unique to the node, including urban art, that are associated with the community’s identity or culture, and that can provide the node with a competitive edge.

Table: Potential built environment features of interest
BUILDINGS stumt-step-4-figure-37 Tips:
Consider historic buildings, unique buildings and buildings of significant architectural value

Example:
27 Boxes shopping center, Melville, Johannesburg, shopping center comprised of containers
URBAN ART stumt-step-4-figure-38 Tips:
Urban art comes in many forms and mediums, including statutes and installations. Cities globally are also commissioning the works of graffiti artists. Also identify kinetic works of art on building facades

Example:
Irene Village Mall, Tshwane
STRUCTURE stumt-step-4-figure-39 Tips:
Identify structures of interest, including infrastructure structures such as telecommunication towers, bridges and canals

Example:
Waterfront canals, Cape Town

Image credit:
SUP Cape Town
PLACES stumt-step-4-figure-40 Tips:
Look for places of high attraction and convergence e.g. squares, parks, promenades and certain sections of streets

Example:
Gandhi Square (precinct), Johannesburg

Image credit:
Gauteng Tourism Authority
LANDSCAPING stumt-step-4-figure-41 Tips:
Look for paving, street signs and other street furniture such as lamp posts, signage and seating places) of unique design, character, pattern, materials type or colour

Example:
Beachfront promenade, Durban
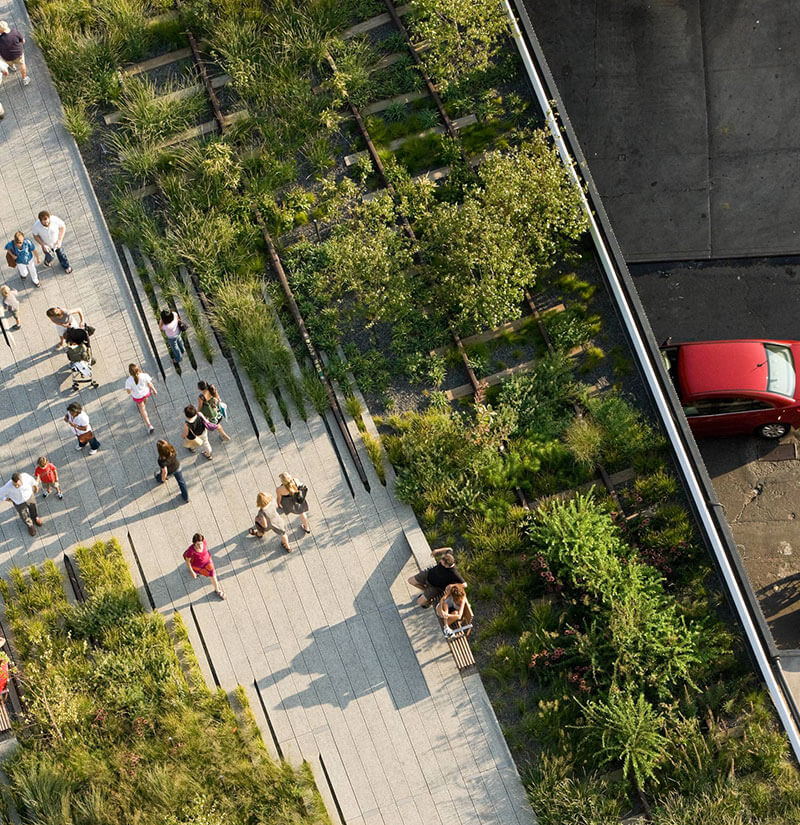
Various techniques can be used to identify built environment character and identity, including:

01

Building age profiling
READ MORE

02

Urban morphology assessment
READ MORE

03

Heritage asset assessment
READ MORE

04

Character appeal
READ MORE
Additionally, the built environment should also be assessed for indications of the following:
  • The extent of personalisation and tailoring of the built environment to suit local needs, customs and preferences – for example painting buildings or building features such as doors in bright or distinctive colours, or using an informally-agreed or distinctive colour palette
  • The degree or pride and ownership that property owners and residents display towards their environment – are buildings, structures etc. well-maintained and neat?
Natural environment
Key aspects or features of the natural environment that may impact on the identity and character of the study area can include:
  • Topography;
  • Vegetation, and specifically are there specific types of trees, scrubs or other plants that characterise the area;
  • Any water features e.g. dams, rivers or streams, or wetlands; and
  • Key views/vistas and sight lines

The assessment of the natural environment in this context does not refer to an environmental assessment as understood in the context of the National Environmental Management Act, but rather to identify characteristic features can that be capitalised or enhanced in the urban design stage.
Social and cultural environment

Precinct design should be considerate and accommodative of local culture, norms and values, traditions, preferences, way-of-life and social networks. This is a balancing act and requires preservation of the authenticity of the area and local culture whilst pursuing the objectives of inclusive design. Some leading questions may include the following:

  • What is the demographic and cultural composition of the node or precinct?
  • Is there a strong street culture? Are there any unique events held in the area, such as local markets or event days
  • Are there local social support systems and if so, what are their focus and how do they function?
  • What are the values and aspirations of the community?
  • Economic organisation:
    • What are the types of economic activity in the area (e.g. retail, business, services or industrial)?
    • Nature of economic organisation: are most businesses informal in nature, are there a few large employers responsible for most of the employment in the area, or is there a significant element of start-up entrepreneurship?
    • Is there a large component of millennials in the local work force?
Concluding remarks on precinct or nodal identity and character
The built environment may reflect a particular character in terms of architectural style and interesting local features – it is also possible that there are differences in character in sub-areas of the precinct. These need to be analysed and recorded, and may offer clues on how to delineate the precinct into sub-precincts where the size and complexity of the precinct warrants it. Similarly, the natural environment and open space needs to be assessed for clues on identity and character, for example the area is characterised by a particular type of tree, or there are defining water features that can, with proper urban design, become standout features of the precinct.

The identity and character of the node or precinct is ultimately defined by the relation and interaction between the built environment, the natural environment and the community (social and cultural aspects). Various techniques for the analysis of identity and character have been described in this sub-section, including walk-throughs, building age analysis, urban morphology analysis, heritage asset audits and character assessment. These need to be complemented by active stakeholder engagement to understand community dynamics, values and norms, needs and aspirations. To the extent possible, all data with the potential for spatial display and analysis should be plotted.
02
Status quo assessment and profiling

The status quo assessment is aimed at developing a profile and baseline information from which to identify opportunities, constraints, challenges and risks that inform the vision and subsequent design, planning and management of the precinct. The status quo assessment is multi-faceted and multi-disciplinary and includes:

Table: Components and aims of the status quo assessment
Focus Aim(s)
Land audit Determine land availability, development status and constraints, ownership and tenure patterns (formal and informal) that will, amongst other, inform the land assembly and release strategy, and the need to cater for informal land users
Real estate analysis Informs the development status of the precinct (e.g. emerging, stable or declining), ability to accommodate multiple land uses, and the costs associated with land assembly, development and redevelopment/upgrading
Socio-economic analysis Determine social and economic capabilities, dynamics, risks, developments, opportunities and trends
Social services and amenities Quantify current and required social services and amenities
Environmental assessment Map and describe environmentally protected and sensitive areas (e.g. wetlands), pollution sources and zones, and related considerations
Geo-technical assessment Identify, describe and map geotechnical conditions and topographical features on a contoured map, and highlight implications for development
Climate assessment Informs urban design requirements e.g. orientation, building heights, wind shielding and micro-climate mitigation
Health impact assessment Identify, describe and map known health-related issues and risks such as air pollution and communicable diseases – these may affect urban design efforts and the provision of social facilities
Accessibility analysis Analyses accessibility and legibility, and identifies obstacles and challenges to movement and accessibility
Transport assessment Analyse road and transportation systems across a range of modes in terms of traffic flows and patterns in relation to spatial configuration and land use
Infrastructure audit Determine the scope of infrastructure provision in terms of scope of infrastructure services offered, committed and actual levels of service, infrastructure capacities, infrastructure lay-out and distribution (must be mapped), utilisation, performance and condition – this information assists to determine whether sufficient infrastructure exists or must be renewed, upgraded or extended, as well as ongoing asset management requirements
Open space assessment Identify, measure, classify, describe, record and map open spaces together with development status, linkages / discontinuities, risks and opportunities for consideration in integrated open space design

01

Land audit
READ MORE

02

Social services and amenities
READ MORE

03

Climate assessment
READ MORE

04

Transport assessment
READ MORE

05

Real estate analysis
READ MORE

06

Environmental assessment
READ MORE

07

Health impact assessment
READ MORE

08

Infrastructure audit
READ MORE

09

Socio-economic analysis
READ MORE

10

Geo-technical assessment
READ MORE

11

Accessibility analysis
READ MORE

12

Open space assessment
READ MORE
03
Develop status quo assessment report and precinct vision

The outcomes of the precinct type and boundary determination (Step 1), stakeholder identification and strategy (Step 2) and status quo assessment (Steps 3.1 – 3.2) are documented in the precinct status quo assessment report.

The type of precinct, its identity and character, and the outcomes of the status quo assessment that identified opportunities, risks, challenges and constraints together with stated stakeholder needs and aspirations informs the vision and objectives for the precinct.

The precinct vision states the desired future role, function and identity of the precinct as a distinct place. A precinct vision:
  • Should be responsive to the context of the precinct and stakeholder needs and aspirations;
  • Demonstrates a strong link to place;
  • Articulates precinct outcomes and user/stakeholder experiences of the precinct following realisation of the vision;
  • Determines qualitative and quantitative outcomes to be achieved;
  • Determines how urban design will need to respond to the character and functioning of the precinct, and in creating the desired sense of place;
  • Should be aspirational but achievable; and
  • Provides the design brief in terms of outcomes to be achieved.

Some level of out-of-the-box thinking may be required when developing the precinct vision. Challenges and obstacles will need to be mitigated or better yet, converted into opportunities. Often, a key challenge in urban upgrading or revitalisation is in dealing with degraded areas or in obsolete structures.

Experiences in South Africa and elsewhere have shown that these challenges can be successfully converted into not just opportunities, but in great drawcards that create identity and improve desirability and vitality, as shown in the following case studies of the Hi Line rail track in New York and in the Orlando Cooling Towers in Soweto.
Case studies
Explore more steps on precinct planning and design

Step 1

Precinct identification & definition
VIEW NOW

Step 2

Stakeholder identification & strategy
VIEW NOW

Step 3

Status quo assessment & precinct visioning
VIEW NOW

Step 4

Design the access & movement network
VIEW NOW

Step 5

Develop land use framework
VIEW NOW

Step 6

Urban design
VIEW NOW

Step 7

Plan finalisation
VIEW NOW
Figure: Precinct planning and design

Step 1

Precinct identification & definition
VIEW NOW

Step 2

Stakeholder identification & strategy
VIEW NOW

Step 3

Status quo assessment & precinct visioning
VIEW NOW

Step 4

Design the access & movement network
VIEW NOW

Step 5

Develop land use framework
VIEW NOW

Step 6

Urban design
VIEW NOW

Step 7

Plan finalisation
VIEW NOW
Scroll to Top
Building age profiling
Description:
Mapping of the age of buildings to understand the age distribution, concentration, style and function(s) of buildings per period or design style.
Value:
Assists in identifying patterns of urban development through the age distribution of building stock and is useful to identify ‘character areas’ or ‘heritage areas.
Methodology:
  1. Decide time periods for analysis purposes (e.g. decade intervals spanning back to 1900, and group buildings prior to 1900 per century).
  2. Identify and map buildings into their corresponding time periods.
  3. Analyse the buildings in a time period to establish prevailing architectural style, building type and other key characteristics e.g. configurations and building materials
Figure: Building age profile
Urban morphology assessment
Description:
A set of techniques used to analyse current and past patterns of urban structure, form, land use, patterns and materials.
Value:
  1. It provides an understanding of the physical form and structure of the node or precinct at multiple scales from individual buildings and stands, through to blocks and street patterns.
  2. It assists to identify both successful and unsuccessful aspects of the study area / intervention area.
  3. Informs design guidelines for character and heritage areas
Methodology:
  1. Built environment elements such as buildings, structures, stands, blocks, street patterns, open space and building details, together with land use trends, are identified, measured, plotted and analysed.
  2. Figure-ground mapping is done where the building footprint is blacked out – this allows analysis of open space and other features.
  3. Typological analysis categorises built environment elements (buildings, stands, blocks etc) into typical and atypical types, with type determined by a combination of design, dimension, orientation and use characteristics – this data is used in character studies and to inform urban design guidelines.
  4. A materials and components analysis documents building and material characteristics – this data can be used to define the character of the area, and to inform urban design guidelines with respect to colour, materials and components
Figure: Figure-ground mapping
Figure: Partial typological analysis (building heights)
Heritage audit
Heritage assets are assets with cultural, environmental, historical, natural, scientific, technological or artistic significance.
Description:
A heritage asset audit identifies, locates, describes and categorises heritage assets in the node or precinct.
Value:
1.Identify precinct character and identity associations
2.Identify potential precinct tourism drawcards
3.Identify ‘character areas’ or ‘heritage areas’
4.Informs design guidelines for character and heritage areas
Methodology:
1.Identify, locate and plot heritage assets
2.Describe and categorise heritage assets (e.g. buildings, urban art/statutes…)
3.Determine ownership status
4.Determine accessibility (open to entry, paid entrance, hours of operation etc., but also accessibility for people with disabilities)
5.Verify official heritage status on national or provincial register, and significance
6.Determine likely demographic appeal and tourism potential
7.Establish any risks associated with the heritage asset (e.g. theft, vandalism, structural integrity etc.)
Figure: Heritage Audit
Character assessment
Description:
Identification and assessment of the significance of elements of character in the study area.
Value:
This technique is particularly useful for identifying and assessing the value and significance of character of especially older areas.
Methodology:
  1. Assessment of visual characteristics of the area, including:
    1. Building assessment (age, type, style, scale and height)
    2. Block sizes and lay-out
    3. Street patterns, width, accommodation of non-motorised use, design and materials type
    4. Stand sizes, coverage, setbacks
    5. Landscape features (paving, open space utilisation, development and integration, street furniture and plants)
  2. Analysis and rating of character aspects and elements in the study area.
Figure: Partial character assessment

Significant buildings:

Old Council Chambers, Renaissance Revival style, commissioned in 1891. Combination brick and sandstone.

Place of Justice, Eclectic Wilhelmiens style, opened 1899. Materials include sandstone columns.

Old Reserve Bank Building, Sir Herbert Baker (architect), 1931. Predominantly granite and sandstone.

General Post Office, neo-Renaissance style, 1910

Land audit

A land audit aims to establish land ownership, land rights in terms of zoning and actual land use. It also aims, where applicable, to determine the extent and dynamics of informal land uses. Land intelligence is critical for precinct planning and urban design in the following ways:

  • It identifies property owners – this information may be necessary where the precinct plan requires land to be assembled, and owners need to be approached to acquire land;
  • It identifies prominent property owners – these would obviously be key stakeholders, and could potentially be approached to form a precinct management association;
  • Zoning rights determine permissible land use, rights and restrictions – these need to be known as key factors in the urban design and/or possible changes to zoning and the land use scheme to support the precinct vision, objectives and plan;
  • Some planned precincts, especially urban hubs, may be areas where there are informal settlers and traders. They too are stakeholders. Construction within the precinct may require temporary or permanent relocation. It is therefore necessary to understand who and how many informal settlers there are, potentially to involve them in consultation and negotiation, and to make arrangements to accommodate them
A robust land audit will typically follow the process outlined below, once the precinct boundaries have been determined:
Figure: Land Audit Process
SOURCES OF INFORMATION FOR LAND AUDIT
SG diagrams and title deeds Office of the Surveyor General
Protected areas and ecologically sensitive areas The South Africa Protected Areas Database (SAPAD) as well as the SA Conservation Areas Data (SACAD) can be downloaded from the following site: http://egis.environment.gov.za/. These are declared (and gazetted) protected areas and conservation areas, updated quarterly.
The South African Biodiversity Institute (SANBI) provides GIS layers that indicates protected areas, critical biodiversity areas (CBAs) and Ecological Support Areas (ESAs). These can be downloaded from https://www.sanbi.org/link/bgis-biodiversity-gis/
A GIS file containing the National Wetlands Inventory can be requested from Department of Environmental Affairs and Tourism (DEAT)
Geotechnical constraints Geotechnical constraints (e.g. dolomite) and soils with special management requirements (e.g. swelling clay) can be sourced from the Agricultural Resource Council (ARC).
The land audit should generate GIS mapped layers as appropriate and the land audit report should address the following matters:
Table: Focus Areas In Land Audit Report
Focus area Content / data set
Land inventory
  • Total land area of the precinct
  • Number of cadastral entities in total, and by land use type
  • Extent and percentage of precinct land area dedicated to roads, road reserves, servitudes and protected open space
  • Extent and percentage of land dedicated to public service infrastructure e.g. rail lines, reservoirs, sub-station etc.
  • Extent and percentage of land otherwise not developable e.g. wetlands, demarcated flood lines and, abandoned mines with high radion levels, land not developable due to soil conditions or topography.
  • Extent and percentage of land developed, in total and by land use type
  • Extent and percentage of land not yet developed/vacant
Ownership
  • Inventory of property owners in the precinct
  • Extent and percentage property ownership in the precinct between municipal, provincial, national, SOE and private owners
  • Listing of large property owners
  • Any discernible trends on property ownership (e.g. mostly owned by municipality, large vacant areas of land owned by a SOE, high degree of fragmentation of land ownership)
Development rights, status & constraints
  • Zoning entitlements and status of exercising thereof (coverage, height etc.)
  • Setbacks
  • Servitudes and rights of way
Development applications
  • Extent, nature and location of development applications – this information can be sourced from municipal registers for applications
Social amenities
  • Social amenities by type and size (e.g. local library, indoor sports & creation facility, park, community hall, primary school etc.) – use the classification system for social amenities as per the CSIR Norms for Social Amenity Provision
  • Indicate the following per social amenity: location, size and ownership status
Informal structures and dwellers
  • Extent and location of informal structures, and associated land use
  • Inventory of informal residents
Opportunities, risks and constraints
  • Key trends
  • Opportunities e.g. consolidation, under-utilised rights, vacant land etc.
  • Constraints e.g. environmental constraints
All of the above should be supported by spatial analysis and maps, such as the following:
Figure: Precinct Property Ownership Profile

Social amenities and services

Objectives
The social amenities and services’ analysis focusses on the following:
  • Range, type and size and ownership status of social facilities within the precinct boundaries, as well as the location of social amenities;
  • Current state of social amenities in terms of condition;
  • Additional social amenities required to serve the intended population size; and
  • Social services provision, e.g. the number of general medical practitioners, dentists etc. operating in the area.
Determine gross demand for social amenities
The social amenity assessment should be conducted using the CSIR Guidelines for the Provision of Social Facilities in South African Settlements, and should indicate the number, size and type of additional social amenities required, as well as the land requirements for these additional amenities.
Social amenities provision
CSIR Guidelines for the Provision of Social Facilities in South African Settlements. First Edition: August 2012 (Reprint: November 2015). Available at: https://www.csir.co.za/csir-guidelines-provision-social-facilities-south-african-settlements.
Determine current supply and adequacy of social amenities
The process is as follows:
  • Identify the range, type and size and ownership status of social facilities within the precinct boundaries, as well as the location of social amenities, and map this data.
  • Conduct social amenity spatial accessibility analysis (walking or driving distances as appropriate)
  • Assess the adequacy of existing social amenities and facilities in terms of:
    • Overall appearance and condition;
    • Capacity e.g. there is a primary health clinic but is under capacitated
    • Range of associated facilities or services, e.g. schools with urban food gardens, or schools with limited, no or underdeveloped sport facilities
Guidance on social amenity provision and associated spatial accessibility analysis
See Sections 4 and 5 of the Cities Infrastructure Delivery and Management System.
Determine net additional demand for social amenities
Subtract existing social amenity provision from gross demand to establish the additional facilities required by type and size, and indicate the extent of land required to develop or upgrade social facilities.
Other social services
Also quantify social services not specifically dealt with in the CSIR Guidelines, such as:
  • Medical care and associated services, e.g. number of general medical practitioners and dentists operating in the area
  • Social and sport clubs, e.g. local soccer club
  • Social support groups, e.g. food programmes and shelters
Opportunities, challenges and constraints
In addition to any issues arising from the above assessment, also assess the sites of social amenities in terms of:
  • Degree of utilisation of social facilities;
  • Level of clustering of social facilities;
  • Extent of underutilised or vacant space/land; and
  • Whether there is scope for social facilities and amenities to fulfil more than one purpose, or for sharing of services and facilities.

Climate assessment

Local climate conditions should be assessed in terms of temperature, wind (prevailing direction, wind speeds) and rainfall. The results of local climate profiling inform urban design responses such as orientation, building heights, wind shielding and micro-climate mitigation.

Transport assessment

The transport assessment involves the following:
  • Identify and map existing public transport services and stops
  • Identify and map limitations for connection via public transport modes with the broader area
  • Map pedestrian and cycling movement patterns and indicate graphically the level of intensity of each
  • Identify and map barriers to pedestrian movement at the local scale
  • Identify and map the hierarchy of roads and lists the class of roads (current and proposed)
  • Identify and map goods’ transportation lines for both road and rail
  • Confirm transport planning for the focus area from the Integrated Transport Plan.

Real estate analysis

The real estate analysis should assess the following, as applicable to the precinct:
Table: Focus Areas In Real Estate Analysis
Focus Area Content/Data Set
General
  • Profiling current real estate availability
  • Assessment of property market rate of activity (number of transfers per annum, spatially)
  • Assessment of existing occupancy and vacancy rates per land use type and per sub-area in the precinct
  • Assessment of market value of properties, by land use type, for developed and vacant properties, and per sub-area in the precinct.
Residential real estate
  • Type, extent and density of residential housing typologies (e.g. informal structures, single residential units, backyard units, walk-ups, high rise flats and hostels);
  • Breakdown of housing ownership / tenure status;
  • Assessment of housing need in the node or precinct, and extent to which there is under or over-supply
Commercial real estate
(business, retail and industrial)
  • Assessment of the real estate characteristics per land use type, for example:
    • Type and extent of commercial and retail solutions (e.g. single storey space, conglomeration into shopping and retail centers and if so, type and size of shopping or retail centers;
    • Type and size of business solutions, e.g. small offices located in houses and single structures, offices located into converted industrial spaces, office blocks or office parks, as well as quality and building ratings; and
    • Type and size of industrial real estate (light, medium or heavy industrial; size and style)
  • For retail, an assessment of the main retail categories (e.g. food & groceries, fashion, home retail, furniture & appliances, health & beauty, entertainment etc.) in terms of:
    • Total expenditure per annum
    • Area average trading density
    • Area total retail demand GLA
    • Area total retail supply in m2, and under- or oversupply per retail category
Outcomes of the real estate analysis informs precinct planning as follows:
  • Quantum of additional real estate required. The current real estate availability indicates the extent of further development required to meet targets established (where already established, as for Urban Hubs);
  • Appropriate mix, quantity and quality of real estate supply is informed by the assessment of the real estate characteristics per land use type;
  • Retail mix and balancing of supply and demand, informed by the retail analysis;
  • Occupancy and vacancy rates also indicate the adequacy of real estate supply, but may further indicate the need for reinvestment (renewal and upgrading), and marketing of the area; and
  • Market values are indicators of the current success or failure of the area, serves as baseline for the measurement of the success of the precinct plan intervention, and may also be necessary in the event that the municipality has to assemble land and other real estate to execute the precinct plan.

Additionally, the real estate analysis may also point to the need to effect changes to zoning and land use, and to urban structuring. Wherever possible, real estate data should be spatially mapped – see examples below:
Figure: Property transaction heat map within the precinct
Figure: Market value of Properties

Environmental analysis

The National Environment Management Act, 1998 (Act No. 107 of 1998) (the NEMA) and the Environmental Impact Assessment Regulations and Listing Notices requires an Environmental Impact Assessment (EIA) to assess, mitigate and/or manage the impacts of a proposed developments and activities that are considered to potentially impact on the right to an environment that is not harmful to health and well-being.

In support of these objectives, an EIA assesses the environmental sustainability of a development proposal, inclusive but not limited to the following:
  • disturbance of ecosystems and loss of biodiversity;
  • pollution and environmental degradation;
  • disturbance of landscapes and cultural heritage;
  • waste – avoidance, minimisation, re-use, recycled, alternatively responsible disposal; and
  • exploitation of non-renewable resources.

The EIA is a legal requirement and all processes upto and including the Record of Decision (RoD) must be followed.

Health impact assessment

A health impact assessment (HIA) assesses the impacts of the built environment and associated policies and programmes on community health, such as air pollution, noise pollution, or levels of stress or mental discomfort.

Infrastructure audit

Infrastructure is a critical requirement for sustainable human settlements and places, including precincts. The aim of the infrastructure audit is to determine the scope, type, capacity, coverage and condition of existing infrastructure in support of the precinct objectives, or alternatively the constraints that existing infrastructure (or the lack thereof) poses to precinct development, renewal or upgrading. The infrastructure audit should address the following issues:

  • The scope and type of existing infrastructure, inclusive of:
    • Roads, road furniture, signalling and signage equipment, sidewalks, cycling lanes and other components of the movement network;
    • Stormwater infrastructure;
    • Potable water
    • Sanitation
    • Electricity and energy
    • Solid waste
    • Telecommunications
  • Infrastructure capacity and ability to accommodate development or further development
  • Positive or negative aspects of infrastructure to the requirements of inclusive urban life and especially for use by people with disabilities, for example tactile paving surfaces to improve the mobility and safety of users with visual impairments – in short, are there infrastructure barriers that limit people with disabilities to fully function in the precinct
  • Condition of infrastructure and any renewal or upgrading requirements
  • Infrastructure-related risks that may impact on the proposed precinct plan.

Socio-economic analysis

The socio-economic analysis provides local demographics and trends, assesses urban crime and safety, and profiles the local economy.
Table: Focus Areas in Socio-economic analysis
Focus Area Content/Data Set
Demographic profiling
  • Population size, composition and dynamics (e.g. nr of households, household size, age distribution of population
  • Level of education
  • Extent of employment in the area
  • Income levels
Crime
  • Crime profile in terms of type, extent and trends
  • Known crime hotspots – identify spatially
  • Areas perceived as unsafe and generally avoided, or avoided at certain times – identify spatially
Economic profiling
  • Sectoral analysis of economic activity and trends – quantitative analysis based on Stats-SA data
  • Description of economic trends in the area (spatial description of prevailing trends)
  • Fixed capital investment
  • Mapping of existing retail/business/industrial hubs
  • Notable local companies and employers (map)
  • Map street vending / hawking and related informal economic activities in the area, noting type, location and extent
  • Confirm and map proposed/planned business opportunities in the node

Crime, or the perception thereof, is a major impediment to successful precincts. In addition to the crime issues dealt with in the table above, a ‘Crime Prevention through Environmental Design’ (CPTED) safety audit identifies the safety concerns of the community within the study area.

A CPTED safety audit focusses on attributes within the built environment that contribute to citizens feeling unsafe and/or to the actual existence of crime, for example poorly lit areas, narrow sidewalks and dark alleys and weak environmental passive surveillance opportunities. The CPTED safety audit actively encourages and seeks opinions from community groups and members on their perceptions of safety in the study area, including from especially vulnerable groups such as women, children, people with disabilities and the elderly.

These results are then interpreted with the intention to develop practical urban design changes towards a safer urban environment.

Geo-technical assessment

Identification of both topographical and landscape features and responsive design results in an urban structure, access and movement network, and built form that integrates well into the environmental, and for enhanced urban design through consideration and spotlighting of local unique or attractive natural features. Identification of these features is an essential requirement for subsequent design of the public realm, for urban landscaping and placemaking, climate risk response and resilience, and development or enhancement of the green space network.

Identify, describe and map geotechnical conditions and topographical features on a contoured map, and highlight implications for development.

Accessibility and legibility assessment

Precincts should be walkable and connected to the broader urban network. Accessibility refers to the ease with which a building, place or facility can be reached by people and/or goods and services. Accessibility can be shown on a plan or described in terms of pedestrian and vehicle movements, walking distance from public transport, travel time or population distribution.

There are four inter-connected issues to be assessed:
  • Patterns associated with the movement of people and goods
  • Accessibility
  • Any discontinuities in movement systems i.e. obstacles and challenges to movement
  • Legibility
Accessibility
Precincts in general should be walkable and urban hubs especially should feature an 800-meter walkshed around the transport hub. This should, barring obstacles and challenges, translate into a 10-minute walking distance.
  • A walk score is based on walking routes to destinations such as retail, schools, amenities and restaurants.
  • A transit score calculates the distance to the closest stop on each route and analyses route type and frequency.
Figure: Access Score
On-line access score tools
Walkscore - www.walkscore.com - please note that the tool can also be applied to local as well as larger “sub-city“ areas, or zones. Mapnificent - www.mapnificent.net - requires that cities provide transit data to the site operators.
Discontinuities, challenges and obstacles in the movement system
There could be multiple challenges and obstacles hindering urban mobility and access, for example long street blocks with limited street crossings, curbs that limit wheelchair crossings, abandoned areas, inaccessible slopes and cut-outs. These need to be identified and mapped, with special attention to the needs of pedestrians and more particularly, to women, children, the elderly and people with disabilities.
Legibility analysis

Legibility is the degree to which a place can be easily understood by its users and the clarity of the image it projects. Legibility is closely associated with urban wayfinding, and the easier it is to find your way, the more accessible an area becomes. Legibility analysis is generally done by assessing the elements of paths, nodes, landmarks, edges and districts as per Kevin Lynch in his book ‘The Image of the City’:

Table: Elements of the Urban Landscape

Public space / open space assessment

What is public space?
The Charter of Public Space defines public space as all those places that are publicly owned and or used by the public, and that are accessible and enjoyable by all for free and without a profit motive (INU, 2013). Public space includes streets, sidewalks, parks, green corridors and undeveloped open public space. Public space is where the public realm is created, offering opportunities for identity creation, collective life, expression of diversity, recreation, physical exercise and regeneration, commercial activities, green space integration and more.
Process
  • Identify, classify (e.g. sidewalks, parks, undeveloped open space) and map all open space and determine ownership status Determine current use/purpose of open space as well as level or intensity of use e.g. area used by informal hawkers or veld used to cross by foot during daytime from one area to another
  • Determine current status of open space in terms of condition, noting degradation and causes thereof
  • Identify open space linkages or potential for linkages as well as challenges and obstacles to open space utilisation and enjoyment
  • Identify opportunities for improvement or enhancement of public space, including opportunities for mixed use and integration